Example
Analytics & Dashboards — Logs Dashboard Example
Analytics & Dashboards — Logs Dashboard Example
This page walks through a real dashboard definition and explains how configuration, filters, metrics, charts, and tables work together to produce the final analytics UI.
This dashboard uses:
- Evidence.dev components (Charts, Stats, DataTable, Inputs)
- CentralSet runtime instead of Evidence’s native data layer
- ETLX-generated datasets and Parquet files
- DuckDB WASM for in-browser analytics
Getting Started With Dashboard
By default, a newly created dashboard is empty and displays only a basic layout with an Edit button.
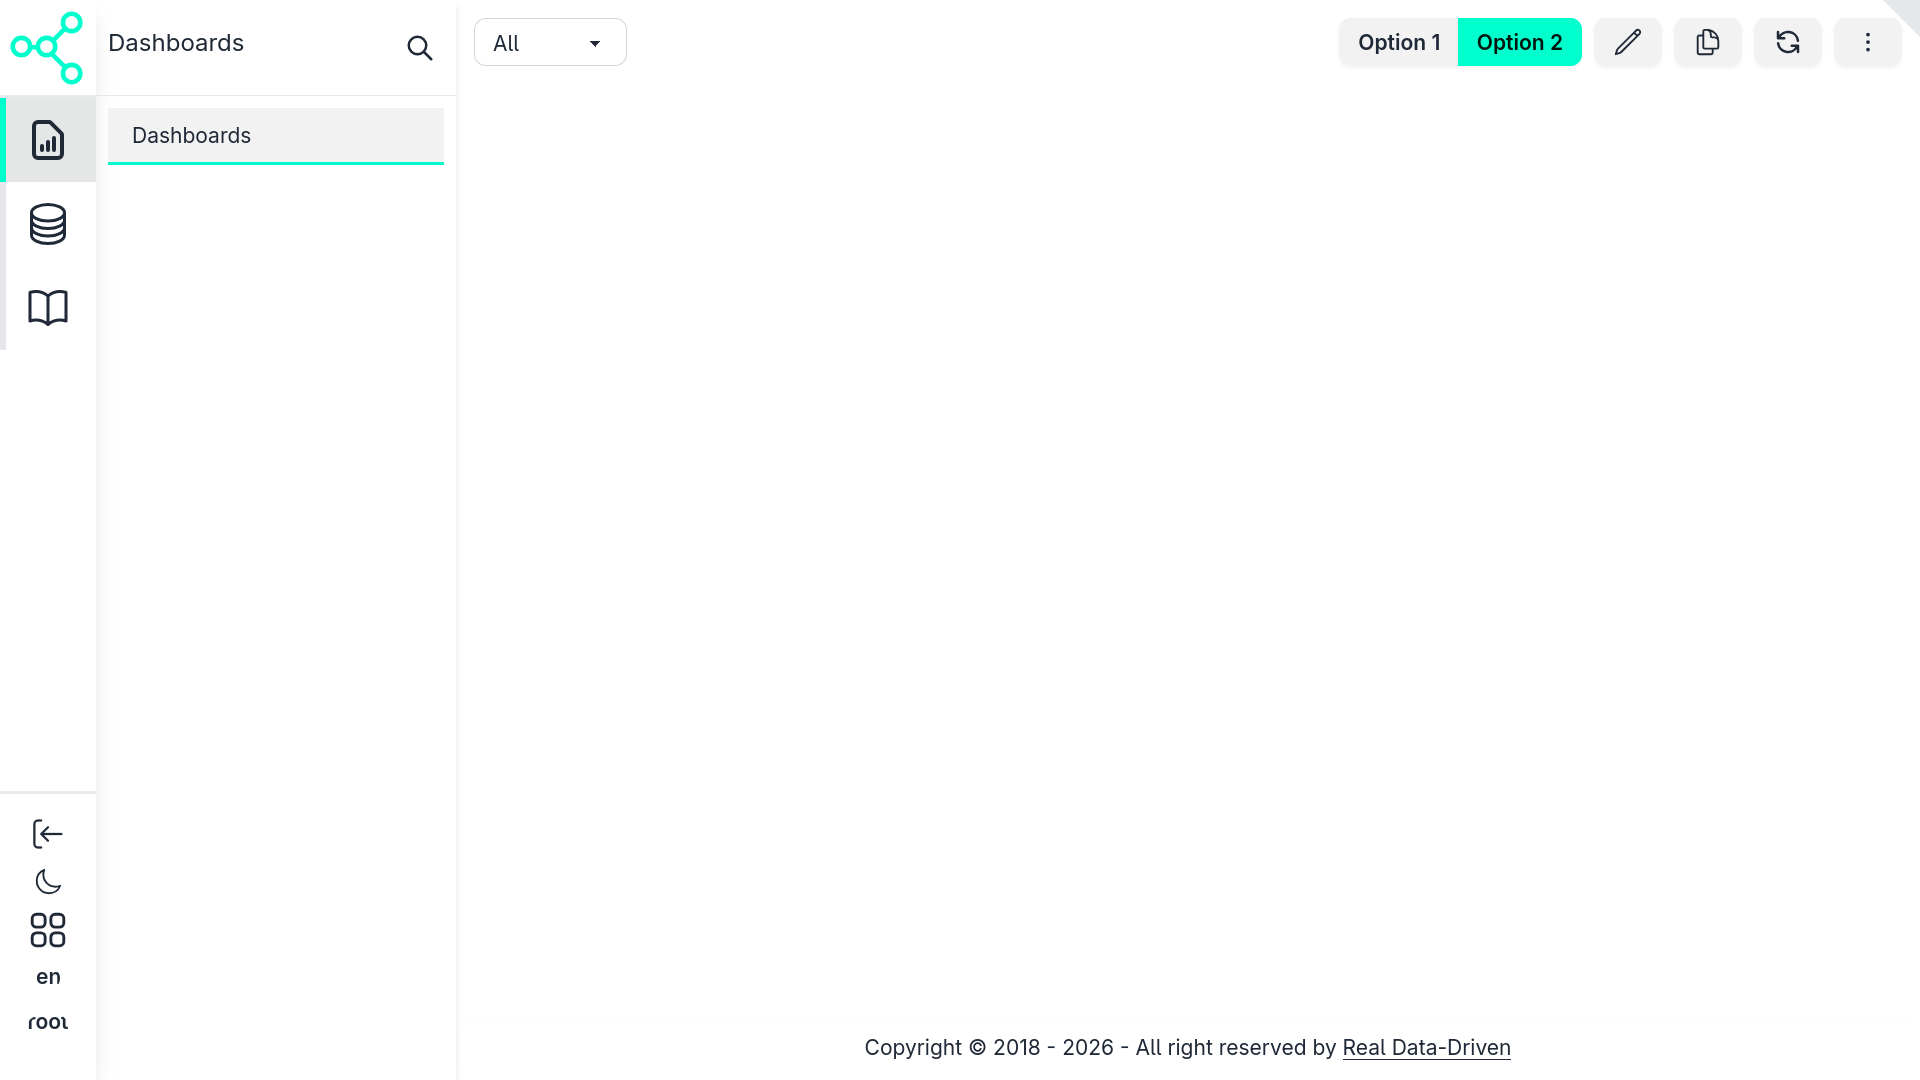
Clicking the Edit button opens the dashboard configuration form, where you can define how the dashboard behaves and what it renders (learn more about configuration).
Once you assign a name and save the configuration, the dashboard becomes active.
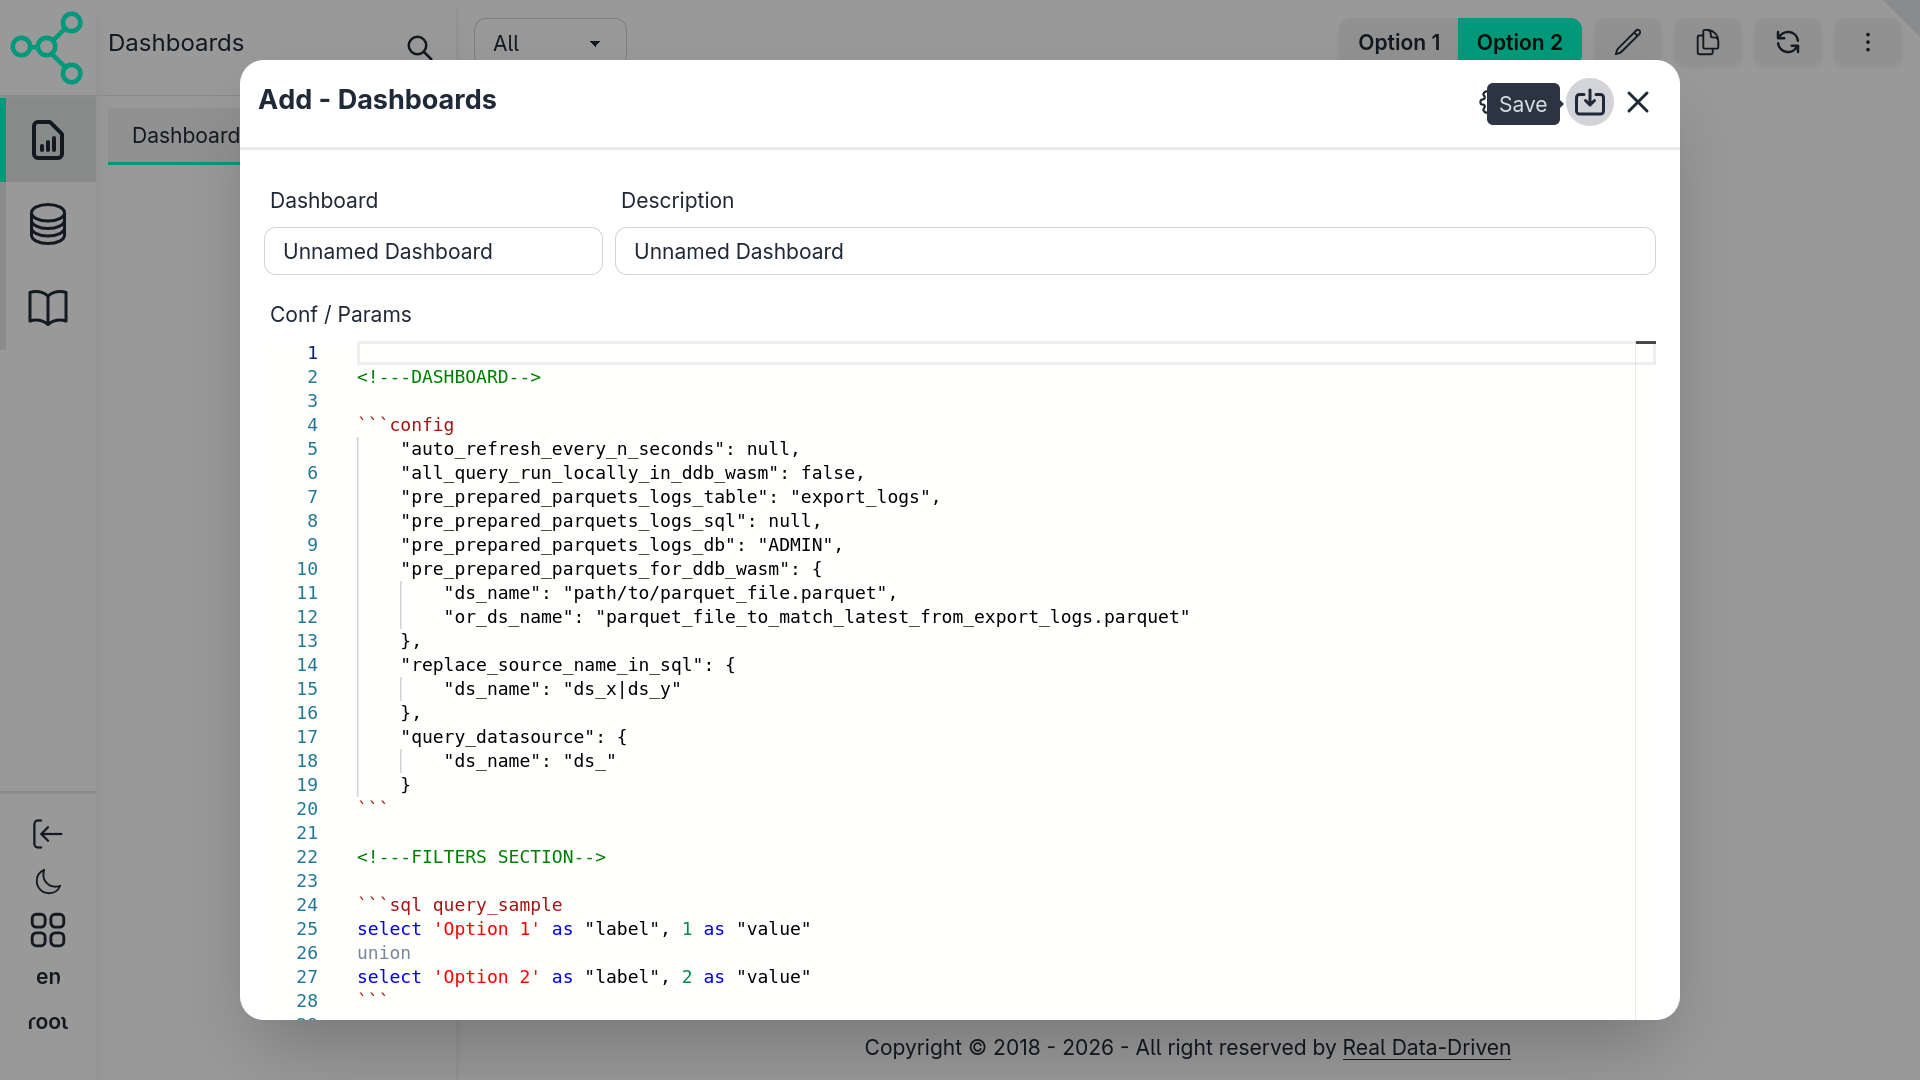
The configuration itself represents an Evidence-like Markdown dashboard, which is:
- Compiled in real time
- Rendered entirely on the client side
- Interpreted as standard Markdown → HTML
- Enhanced with interactive components
If components are referenced, they are loaded as native Svelte components, just like any other part of the Central Set UI.
How Rendering Works
Under the hood:
Markdown is rendered as regular HTML
SQL blocks are detected and executed dynamically
Query execution depends on the dashboard configuration:
- In-browser databases (DuckDB WASM)
- Databases mapped in Central Set
- Datasets produced by ETLX pipelines
The query results are then injected directly into components such as charts, tables, stats, and filters.
This approach allows dashboards to feel live, interactive, and fully integrated, without requiring a static build step or server-side compilation.
This Example
This example use the ETLX sqlite exemple also used in this doc in ETLX & Data Pipelines use to demostrate a basic setup with an embbed database with no databse server setup:
1. Dashboard Configuration Block
Every dashboard starts with a config block.
This is where CentralSet overrides Evidence defaults and wires the dashboard to ETLX outputs.
  "auto_refresh_every_n_seconds": null,
"all_query_run_locally_in_ddb_wasm": true,
"pre_prepared_parquets_logs_table": null,
"pre_prepared_parquets_logs_sql": "with _logs as (select * from etlx_logs where fname is not null and (fname, end_at) in (select fname, max(end_at) from etlx_logs group by fname)) select item_key as name, replace(fname, 'tmp/', '') as file FROM _logs",
"pre_prepared_parquets_logs_db": "sqlite3:database/sqlite_ex.db",
"pre_prepared_parquets_for_ddb_wasm": {
    "LOGS": "hist_logs.parquet"
},
"replace_source_name_in_sql": {
    "ds_name": "ds_x|ds_y"
},
"query_datasource": {
    "ds_name": "ds_"
}
What this configuration does
Execution model
all_query_run_locally_in_ddb_wasm: true(RECOMENDED) → All SQL runs inside the browser using DuckDB WASM.
Data source binding
pre_prepared_parquets_for_ddb_wasmMaps logical table names (LOGS) to ETLX-exported Parquet files.
This means:
FROM "LOGS"
actually reads from hist_logs.parquet.
Pre-prepared metadata
pre_prepared_parquets_logs_sqlUsed to discover available log files and metadata before loading the dashboard.
Source name normalization
replace_source_name_in_sqlandquery_datasourceAllow dashboards to stay portable, even when datasets are renamed or versioned.
📸 What you see in the UI The dashboard loads instantly with no backend round-trips, powered entirely by Parquet + WASM.
2. Filters Section (User Controls)
Filters define how users interact with the data. Each filter is backed by SQL queries that populate dropdowns and inputs.
2.1 Reference Date Selector
  select distinct strftime("ref"::date, '%Y-%m-%d') "ref"
from "LOGS"
where "ref" is not null
order by "ref" desc
Purpose
- Extracts all available reference dates from logs
- Feeds the date picker suggestions
📸 UI result A date input that suggests only valid dates present in the data.
2.2 Process Hierarchy Filters
Main Process
  select distinct "key" as "main_process"
from "LOGS"
Sub Process
  select distinct "item_key" as "sub_process"
from "LOGS"
where "item_key" is not null
These queries populate hierarchical dropdowns:
- Main Process → high-level ETLX step
- Sub Process → specific task within the step
2.3 Success / Failure Filter
  select *
from (values
    ('%', 'ALL'),
    ('true', 'TRUE'),
    ('false', 'FALSE')
) t ("val", "desc")
Allows filtering logs by:
- All
- Successful runs
- Failed runs
2.4 Filter Layout (Grid)
  <Grid>
    <GridItem>
        <Input type=date ... input_label="Reference Date" />
    </GridItem>

    <GridItem>
        <Input type=date ... input_label="Reference Date N-1" />
    </GridItem>

    <GridItem>
        <Dropdown ... input_label='Main Process'/>
    </GridItem>

    <GridItem>
        <Dropdown ... input_label='Sub Process'/>
    </GridItem>

    <GridItem>
        <RadioButtons input_label="Status" />
    </GridItem>

    <GridItem class='grow'/>

    <GridItem>
        <Button icon="pencil" tooltip="Edit"/>
    </GridItem>

    <GridItem>
        <Button icon="refresh" tooltip="Update"/>
    </GridItem>
</Grid>
📸 UI result
- A compact control bar
- Filters on the left
- Action buttons (edit, refresh, duplicate) on the right
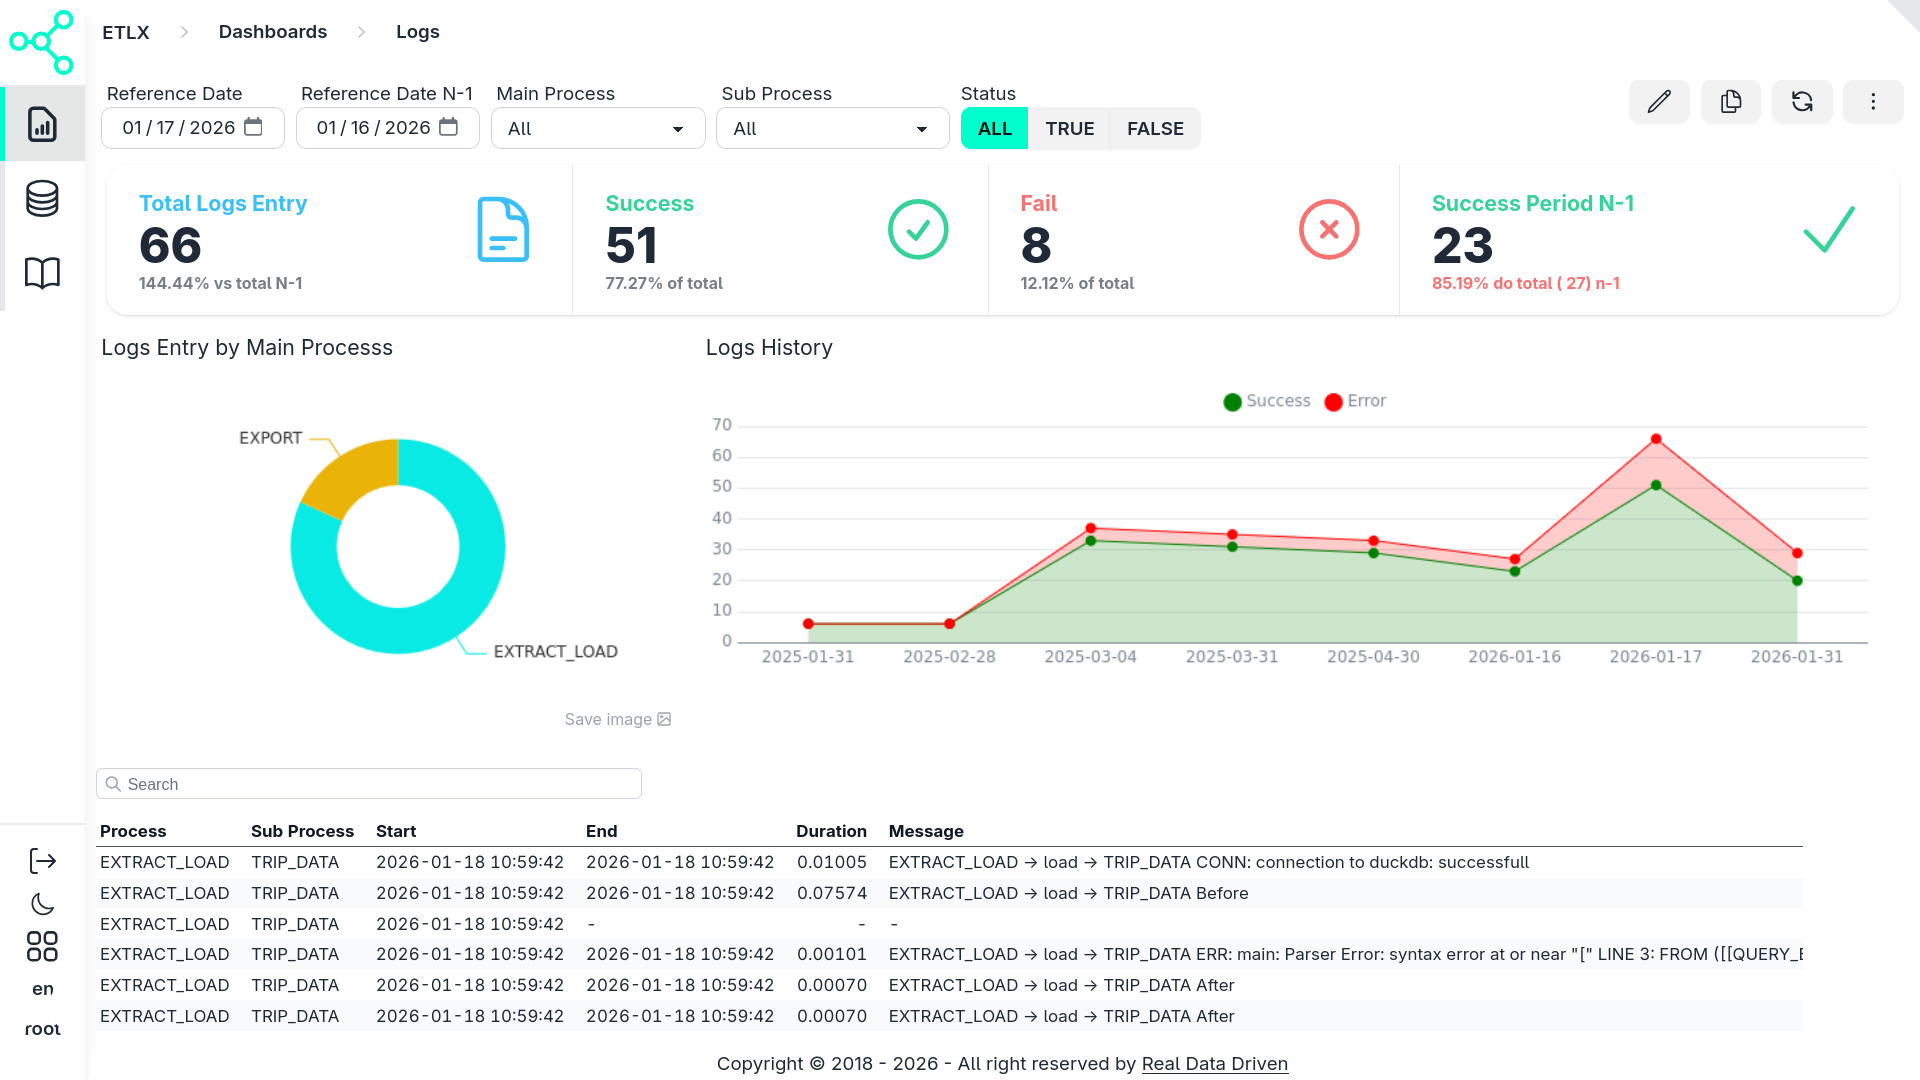
3. Big Numbers (KPIs)
The Big Numbers section summarizes system health at a glance.
3.1 KPI Query
  select
    count(*) filter("ref" = 'inputs.date_ref.value') as "total",
    count(*) filter("ref" = 'inputs.date_ref.value' and success) as "total_success",
    count(*) filter("ref" = 'inputs.date_ref.value' and not success) as "total_fail",
    total_success / total as "success_delta",
    total_fail / total as "fail_delta",
    count(*) filter("ref" = 'inputs.date_ref_n1.value') as "total_n1",
    ((total - total_n1) / total_n1) as "total_delta"
from "LOGS"
where "key" like 'inputs.main_process.value'
    and "item_key" like 'inputs.sub_process.value'
This query:
- Compares today vs N-1
- Computes success/failure ratios
- Powers KPI deltas
3.2 KPI Rendering
  <Stats>
    <Stat>
        <StatFigure icon='document-text'/>
        <StatTitle># Total Logs Entry</StatTitle>
        <StatValue value=total />
        <StatDesc value=total_delta fmt=pct2 />
    </Stat>

    <Stat>
        <StatFigure icon='check-circle'/>
        <StatTitle># Success</StatTitle>
        <StatValue value=total_success />
    </Stat>

    <Stat>
        <StatFigure icon='x-circle'/>
        <StatTitle># Fail</StatTitle>
        <StatValue value=total_fail />
    </Stat>
</Stats>
📸 UI result
- Large numeric tiles
- Color-coded status
- Percentage deltas vs previous period
4. Charts Section
This section explains why things changed, not just what changed.
4.1 Logs by Process (Pie Chart)
  select "key" as "name", count(*) as "value"
from "LOGS"
where "ref" = 'inputs.date_ref.value'
group by "key"
  <ECharts
    config={{
        series: [{
            type: 'pie',
            radius: ['40%', '70%'],
            data: queries.total_by_process_query.data
        }]
    }}
/>
📸 UI result
- Donut chart showing log volume by process
- Quickly highlights bottlenecks
4.2 Logs Over Time (Area Chart)
  select
    "ref"::varchar as "dt",
    case when success then 'Success' else 'Error' end as "category",
    count(*) as "total"
from "LOGS"
group by "ref", category
order by "ref"
  <AreaChart
    data={total_by_ref_query}
    x=dt
    y=total
    series=category
/>
📸 UI result
- Time series of successes vs errors
- Clear trend visibility
5. Log Details Table
The final section lets users drill into raw data.
5.1 Logs Query
  select *
from "LOGS"
where "ref" = 'inputs.date_ref.value'
order by "start_at"
5.2 DataTable
  <DataTable data={_logs} rows=20 search=true>
    <Column id=key title="Process"/>
    <Column id=item_key title="Sub Process"/>
    <Column id=start_at title="Start"/>
    <Column id=end_at title="End"/>
    <Column id=duration title="Duration"/>
    <Column id=msg title="Message"/>
    <Column id=success title="Success"/>
</DataTable>
📸 UI result
- Paginated
- Searchable
- Ideal for debugging failed ETLX runs
How This Differs From Native Evidence
| Feature | Evidence | CentralSet |
|---|---|---|
| Data Source | SQL files | ETLX Parquet outputs |
| Runtime | Node / DB | DuckDB WASM |
| Config | sources.yml | Embedded config block |
| Deployment | Evidence app | Embedded dashboard |
| Purpose | BI | BI / Operational analytics |
Putting it all together:
A dashboard configuration (logs_dashboard.md) looks like:
  <!---DASHBOARD-->

```json config
    "auto_refresh_every_n_seconds": null,
    "all_query_run_locally_in_ddb_wasm": true,
    "pre_prepared_parquets_logs_table": null,
    "pre_prepared_parquets_logs_sql": "with _logs as (select * from etlx_logs where fname is not null and (fname, end_at) in (select fname, max(end_at) from etlx_logs group by fname)) select item_key as name, replace(fname, 'tmp/', '') as file FROM _logs",
    "pre_prepared_parquets_logs_db": "sqlite3:database/sqlite_ex.db",
    "pre_prepared_parquets_for_ddb_wasm": {
        "LOGS": "hist_logs.parquet"
    },
    "replace_source_name_in_sql": {
        "ds_name": "ds_x|ds_y"
    },
    "query_datasource": {
        "ds_name": "ds_"
    }
```

<!---FILTERS SECTION-->

<!-- DATE (add option to sugest dates that alread in the database to the compenent) -->
```sql _dts
select distinct strftime("ref"::date, '%Y-%m-%d') "ref"
from "LOGS"
where "ref" is not null
order by "ref" desc
```

<!-- LEVEL 1 - PROCESS -->
```sql main_process_query
select distinct "key" as "main_process"
from "LOGS"
```

<!-- LEVEL 2 - ITEMS -->
```sql sub_process_query
select distinct "item_key" as "sub_process"
from "LOGS"
where "item_key" is not null
```

<!-- SUCCESS -->
```sql query_success
select *
from (values
    ('%', 'ALL')
    , ('true', 'TRUE')
    , ('false', 'FALSE')
) t ("val", "desc")
```

<Grid>
    <GridItem width='w-auto' _type='auto' _class='p-1'>
        <Input type=date
            defaultValue={config?.moment()?.subtract(1, 'day').format('YYYY-MM-DD')}
            _class='input input-sm input-bordered'
            list=dates
            data={_dts}
            name=date_ref
            options_value=ref
            options_label=ref
            input_label="Reference Date"
        />
    </GridItem>
    <GridItem width='w-auto' _type='auto' _class='p-1'>
        <Input type=date
            defaultValue={config?.moment()?.subtract(2, 'day').format('YYYY-MM-DD')}
            _class='input input-sm input-bordered'
            name=date_ref_n1
            input_label="Reference Date N-1"
        />
    </GridItem>
    <GridItem width='w-auto' _type='auto' _class='p-1'>
        <Dropdown data={main_process_query} name=main_process value=main_process label=main_process defaultValue="%" input_label='Main Process'>
            <DropdownOption value="%" valueLabel="All"/>
        </Dropdown>
    </GridItem>
    <GridItem width='w-auto' _type='auto' _class='p-1'>
        <Dropdown data={sub_process_query} name=sub_process value=sub_process label=sub_process defaultValue="%" input_label='Sub Process'>
            <DropdownOption value="%" valueLabel="All"/>
        </Dropdown>
    </GridItem>
    <GridItem width='w-auto !align-bottom' _type='auto' _class='p-1'>
        <RadioButtons
            data={query_success}
            name=success
            value=val
            label=desc
            defaultValue=nth_0
            _class='btn-sm'
            input_label="Status"
        />
    </GridItem>
    <GridItem width='w-auto' _type='auto' _class='p-1 grow'/>
    {#if $_global?.tables?.[$$props?.table]?.permissions?.create === true || !$_global?.tables?.[$$props?.table]?.permissions}
    <GridItem width='w-auto' _type='auto' _class='p-1 text-left'>
        <Button tooltip="Edit" name = "edit" action = "edit" label="" icon = "pencil" _class='btn-sm btn-gost' />
    </GridItem>
    {/if}
    {#if $_global?.tables?.[$$props?.table]?.permissions?.create === true || !$_global?.tables?.[$$props?.table]?.permissions}
    <GridItem width='w-auto' _type='auto' _class='p-1 text-left'>
        <Button tooltip="Duplicate" name = "duplicate" action = "duplicate" label="" icon = "document-duplicate" _class='btn-sm btn-gost' />
    </GridItem>
    {/if}
    <GridItem width='w-auto' _type='auto' _class='p-1 text-left'>
        <Button tooltip="Update" name = "refresh" action = "refresh" label="" icon = "refresh" _class='btn-sm btn-gost' />
    </GridItem>
    {#if $_global?.tables?.[$$props?.table]?.permissions?.create === true || !$_global?.tables?.[$$props?.table]?.permissions}
    <GridItem width='w-auto' _type='auto' _class='p-1 text-left'>
        <Button tooltip="Details" name = "details" action = "details" label="" icon = "ellipsis-vertical" _class='btn-sm btn-gost' />
    </GridItem>
     {/if}
</Grid>

<!---DASHBOARD SECTION-->

<!-- BIG NUMBERS SECTION -->
```sql big_numbers_query
select count(*) filter("ref" = 'inputs.date_ref.value') as "total"
    , count(*) filter("ref" = 'inputs.date_ref.value' and ("success" is true or "success" = 1)) as "total_success"
    , count(*) filter("ref" = 'inputs.date_ref.value' and ("success" is false or "success" = 0)) as "total_fail"
    , total_success / total as "success_delta"
    , total_fail / total as "fail_delta"
    , count(*) filter("ref" = 'inputs.date_ref_n1.value') as "total_n1"
    , count(*) filter("ref" = 'inputs.date_ref_n1.value' and ("success" is true or "success" = 1)) as "total_success_n1"
    , count(*) filter("ref" = 'inputs.date_ref_n1.value' and ("success" is false or "success" = 0)) as "total_fail_n1"
    , total_success_n1 / total_n1 as "success_delta_n1"
    , total_fail_n1 / total_n1 as "fail_delta_n1"
    , ((total - total_n1) / total_n1) as "total_delta"
from "LOGS"
where "key" like 'inputs.main_process.value'
    and "item_key" like 'inputs.sub_process.value'
    and case
        when "success" is true or "success" = 1 then 'true'
        else 'false'
    end like 'inputs.success.value'
```
<Div _class="w-full p-2">
    <Stats _class='shadow' name=big_numbers_select>
        <Stat name=total parent_name=big_numbers_select bg_selected='bg-base-200'>
            <StatFigure _class='text-info p-0 w-14 h-14' icon='document-text' />
            <StatTitle _class='text-info font-bold'># Total Logs Entry</StatTitle>
            <StatValue _class=''
                data={big_numbers_query}
                value=total
                fmt=num0
                name=total
            />
            <StatDesc _class=''
                data={big_numbers_query}
                value=total_delta
                fmt=pct2
                title='vs total N-1'
            />
        </Stat>
        <Stat name=total_success parent_name=big_numbers_select bg_selected='bg-base-200'>
            <StatFigure _class='text-success p-0 w-14 h-14' icon='check-circle'/>
            <StatTitle _class='text-success font-bold'># Success</StatTitle>
            <StatValue _class=''
                data={big_numbers_query}
                value=total_success
                fmt=num0
                name=total_success
            />
            <StatDesc _class=''
                data={big_numbers_query}
                value=success_delta
                fmt=pct2
                title='of total'
            />
        </Stat>
        <Stat name=total_fail parent_name=big_numbers_select bg_selected='bg-base-200'>
            <StatFigure _class='text-error p-0 w-14 h-14' icon='x-circle'/>
            <StatTitle _class='text-error font-bold'># Fail</StatTitle>
            <StatValue _class=''
                data={big_numbers_query}
                value=total_fail
                fmt=num0
                name=total_fail
            />
            <StatDesc _class=''
                data={big_numbers_query}
                value=fail_delta
                fmt=pct2
                title='of total'
            />
        </Stat>
        <Stat name=total_success_n1 parent_name=big_numbers_select bg_selected='bg-base-200'>
            <StatFigure _class='text-success p-0 w-14 h-14' icon='check'/>
            <StatTitle _class='text-success font-bold'># Success Period N-1</StatTitle>
            <StatValue _class=''
                data={big_numbers_query}
                value=total_success_n1
                fmt=num0
                name=total_success_n1
            />
            <StatDesc _class='text-error'
                data={big_numbers_query}
                value=success_delta_n1
                fmt=pct2
                --title='of total'
            >do total ({queries?.big_numbers_query?.data?.[0]?.total_n1}) n-1
            </StatDesc>
        </Stat>
    </Stats>
</Div>
<!--{inputs?.big_numbers_select?.value}-->

<!-- CHART EXEMPES -->
```sql total_by_process_query
select "key" as "name", count(*) as "value"
from "LOGS"
where "ref" = 'inputs.date_ref.value'
    and "key" like 'inputs.main_process.value'
    and "item_key" like 'inputs.sub_process.value'
    and case
        when "success" is true or "success" = 1 then 'true'
        else 'false'
    end like 'inputs.success.value'
group by "key"
```
```sql total_by_ref_query
select "ref"::varchar as "dt"
    , case
        when "success" is true or "success" = 1 then 'Success'
        else 'Error'
    end as "category"
    , count(*) as "total"
from "LOGS"
where "key" like 'inputs.main_process.value'
    and "item_key" like 'inputs.sub_process.value'
    and case
        when "success" is true or "success" = 1 then 'true'
        else 'false'
    end like 'inputs.success.value'
group by "ref", case
        when "success" is true or "success" = 1 then 'Success'
        else 'Error'
    end
order by "ref" asc
```
<Grid>
    <GridItem width=4 _class='p-1'>Logs Entry by Main Processs</GridItem>
    <GridItem width=8 _class='p-1'>Logs History</GridItem>
    <GridItem width=4 _class='p-1'>
        <!-- https://docs.evidence.dev/components/charts/custom-echarts/ -->
        <ECharts config={{
                tooltip: { formatter: '{b}: {c} ({d}%)' },
                //height: 230,
                color: ['#08eae3ff', '#eab308', '#ea08d7ff', '#0c08eaff', '#ea081fff'],
                series: [{
                    type: 'pie',
                    radius: ['40%', '70%'],
                    data: [...queries?.total_by_process_query?.data]
                }]
            }}
            height=230px
        />
    </GridItem>
    <GridItem width=8 _class='p-1'>
        <!-- https://docs.evidence.dev/components/charts/area-chart/ -->
        <AreaChart
            data={total_by_ref_query}
            x=dt
            y=total
            series=category
            fillOpacity=0.2
            seriesColors={{'Success': 'green', 'Error': 'red'}}
            sort=false
            markers=true
            height=230px
        />
    </GridItem>
</Grid>

<!-- LOG DETAILS - DATATABLE -->

```sql _logs
select * replace(
    strftime("start_at"::datetime, '%Y-%m-%d %H:%M:%S') as "start_at"
    , strftime("end_at"::datetime, '%Y-%m-%d %H:%M:%S') as "end_at"
)
from "LOGS"
where "ref" = 'inputs.date_ref.value'
    and "key" like 'inputs.main_process.value'
    and "item_key" like 'inputs.sub_process.value'
    and case
        when "success" is true or "success" = 1 then 'true'
        else 'false'
    end like 'inputs.success.value'
order by "start_at" asc
```


<DataTable data={_logs}
    rowShading=true
    rowLines=false
    rows=20
    search=true
>   <Column id=key title="Process"/>
	<Column id=item_key  title="Sub Process"/>
	<Column id=start_at title=Start/>
	<Column id=end_at title=End/>
	<Column id=duration title=Duration/>
	<Column id=msg title=Message/>
	<Column id=success title=Success/>
</DataTable>
The resulting dashboard
Summary
This dashboard demonstrates how ETLX + CentralSet turns operational logs into:
- Instant analytics
- Zero-backend dashboards
- Fully portable markdown definitions
It combines:
- SQL for logic
- Evidence components for UI
- Parquet for performance
Last updated 22 Feb 2026, 16:48 -01 .